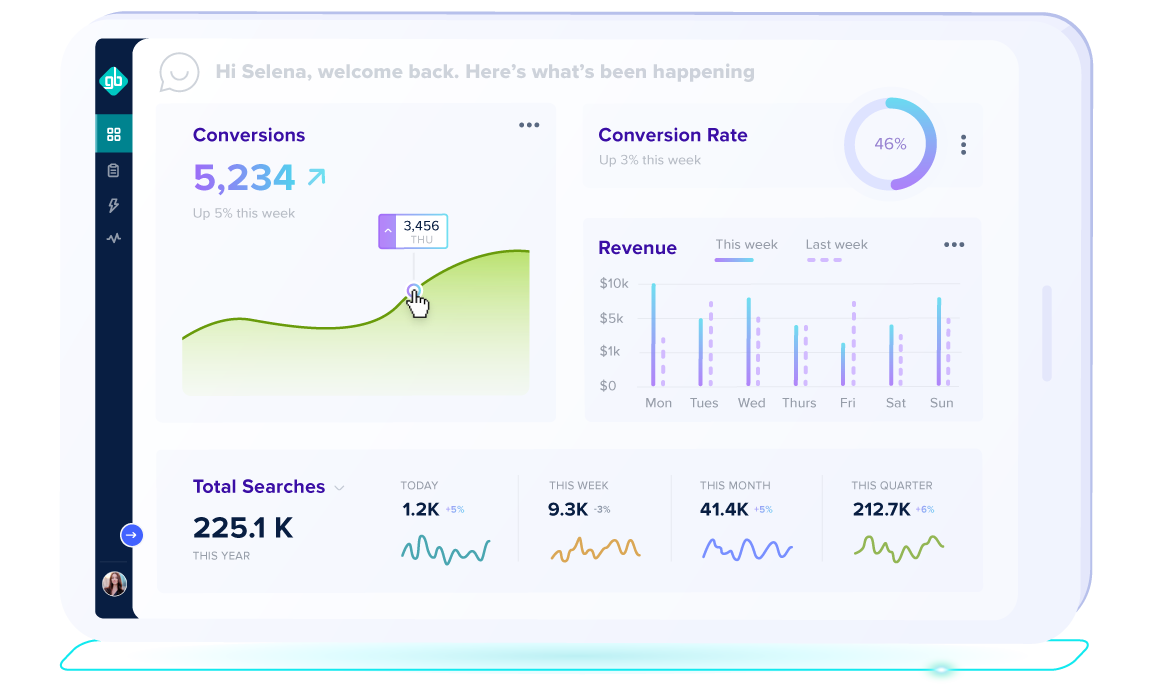
GroupBy tags collect data at every point on your site which is then processed and aggregated into tables and dashboards to give a visual view of your website and customer behavior. Use these dashboards to see how customers are interacting with your site and what leads to higher conversions and revenue.
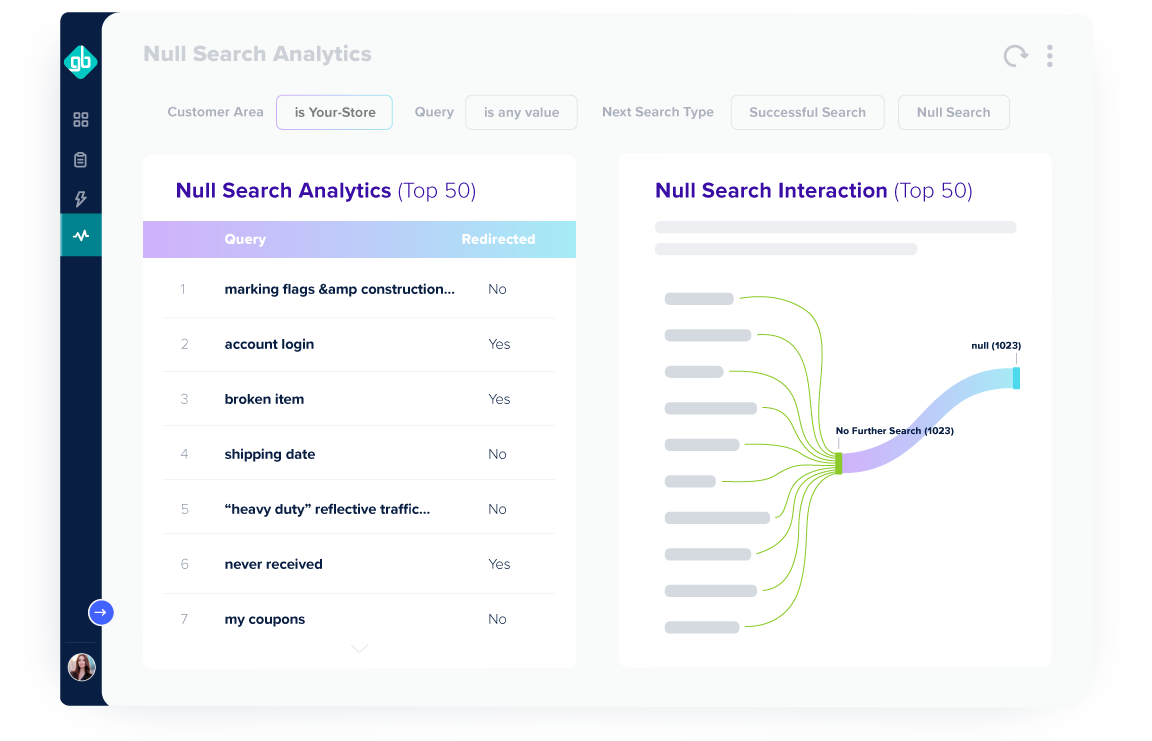
See aggregated results with performance indicators of your customer journeys as they search and browse, allowing you to easily identify underperforming search terms, browse paths, navigation and refinements, or recommendations. Analytics suggests improvements and missed opportunities and provides the tools to implement them.
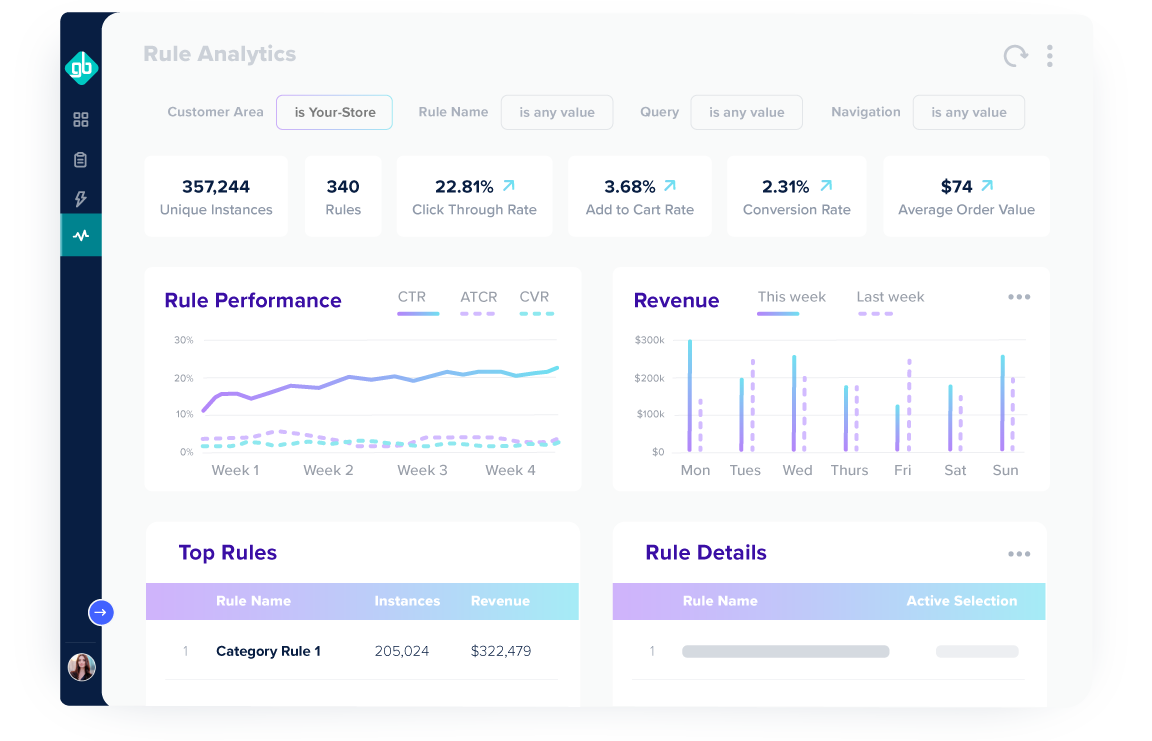
Implement insights and receive feedback on how those changes are performing. Monitor which rules and A/B tests are having a positive impact by tracking metrics such as click-through rate, conversion rate, revenue generated.
View overall site performance and see how GroupBy products are performing. Connect how customers shop in-store to their customer profile and track how browse, search, and recommendations are performing against KPIs.
Gain actionable insights to optimize merchandising strategies and build targeted campaigns while measuring their performance
Modern BI and analytics tools enable you to easily view and share key metrics with stakeholders such as search, recommendations performance, rule-level analytics and navigation engagement
Measure the performance of your merchandising campaigns/configurations through easy to set-up A/B testing
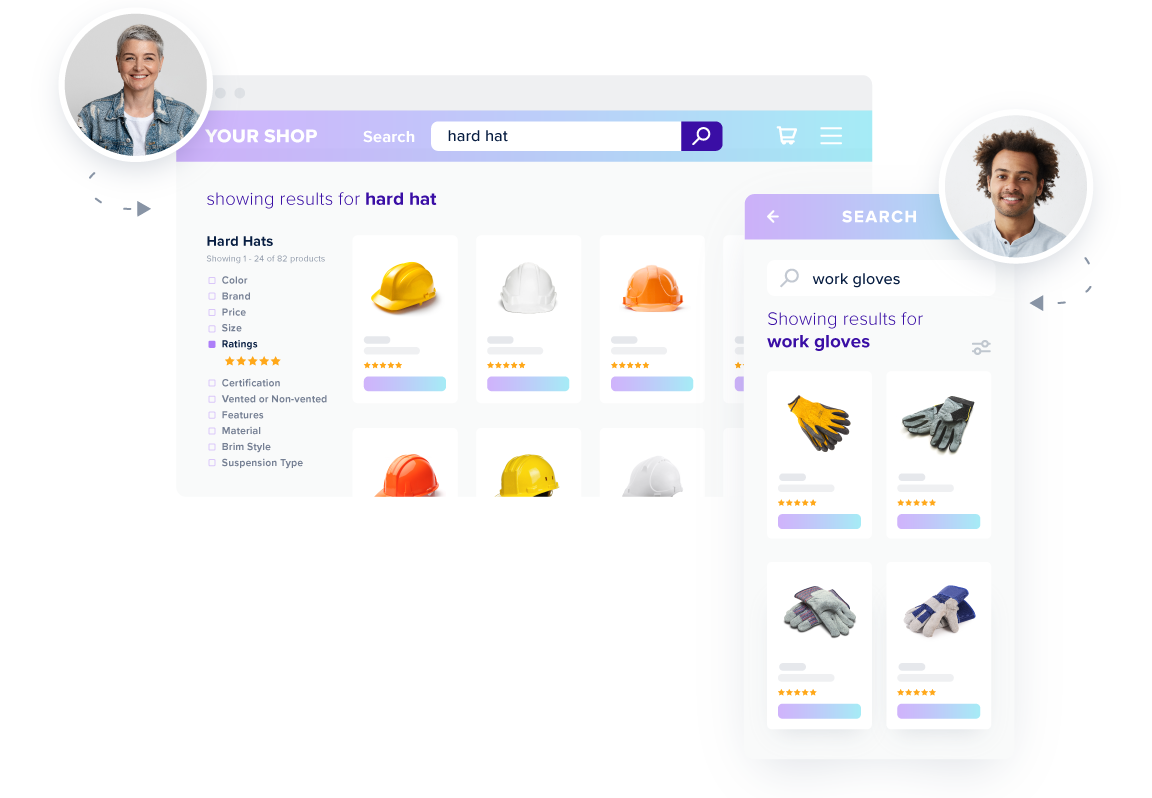
Identify user search and purchasing patterns to drive your merchandising strategies
Capture user events to identify shopper habits and understand their intent
View catalog inventory status at a glance to inform your procurement and fulfillment strategies